

Before the Dashboard - When the Data Starts Talking Back
24 Oct 2026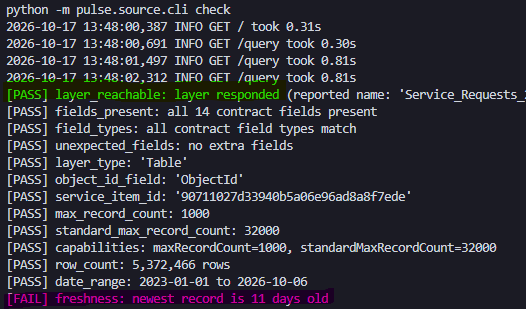 |
|---|
| A Status Check on CoCT SR Layer |
Disclaimer: This post is not to discredit datasets shared by The City of Cape Town but is a personal reflection on practical data quality issues that became an opportunity of learning on the subject.
I have always been intrigued by the City of Cape Town’s (CoCT) service request data. I perceive it to be a proxy of the municipality’s pulse. So I find myself returning to it. Equipped with a better data science toolbox, I set out to approach it programmatically and not by bruteforce nor rudiment.
I downloaded a snapshot of the City’s Service Request dataset covering January 2023 to October 2026. It contained more than 5.3 million rows. The first temptation was “What can I visualise?” But the fisrt question was “What does this data believe it is?”
The intention was to have a live tap to the source but, the endpoint was soon after discontinued and I had to work with the snapshot.
1. Puttting A Source Data Contract in Place
A pre-profiling step was putting in place a source data contract which recorded the CoCT ArcGIS layer URL, service item ID and layer type. The contract goes on to describe 14 expected fields and their roles:
| Field | Description |
|---|---|
| ObjectId | technical row identifier |
| Notification | business identifier for a service request |
| Notification_type | operational request description |
| C3_Complaint_Type | complaint category |
| Work_Center | operational assignment field |
| Suburb, Ward and Sub_Council | geographic attributes |
| X_Y_Co_ordinate_1 and X_Y_Co_ordinate_2 | coordinate values |
| Created_On_Date, Changed_on and Completed_Date | lifecycle dates |
The following fields were identified for key checks such as whether requests repeat, whether dates are plausible and whether coordinate values are complete and valid.
Profiling showed that Notification is repeated and as such could not be treated as a unique row key.
| Key Role | Source Field |
|---|---|
| Business key | Notification |
| Created date | Created_On_Date |
| Changed date | Changed_on |
| Completed date | Completed_Date |
| Coordinate fields | X_Y_Co_ordinate_1, X_Y_Co_ordinate_2 |
| Timezone | Africa/Johannesburg |
The contract established the expectations against which the data could be tested were it to be provisioned constantly. It is the dataset’s point of entry into the pipeline and does not assume that the data is clean.
2. Profiling 5.3 million service-request records
A copy of the data was profiled by measuring:
- Total rows
- Distinct business keys
- Nulls and blanks
- Date ranges
- Distinct values
- Repeated-key rates
- Coordinate completeness and
- Rows by time period.
The following were some key findings:
THE BUSINESS KEY
- The snapshot contained 5,372,466 rows.
Notificationwas not unique and 709,092 request numbers appeared more than once, producing 946,523 extra rows, approximately 17.6% of the table.
A row is therefore not necessarily a request. Counting rows directly would overstate totals.
- 566,194 ‘Notification’ values were exact copies apart from ‘ObjectId’. Another 142,898 repeated values differed in at least one field, commonly
Ward,Coordinates, Dates,Sub_Council,Notification_typeorSuburb.
As such, The data rejected a simple rule to “keep the latest row” - 7,815 requests had both open and closed rows and 107,994 repeated groups had tied latest timestamps with different content.
TEXT AS DISTRIBUTIONS
For each text field, record raw distinct values, values after trimming and casenormalisation, nulls, blanks, singleton values and coverage of the top values.
C3_Complaint_Type behaved like a controlled category: 1,154 raw values and 85.3% of rows covered by the top 100.
Notification_typehad 1,630,557 raw values and 1,308,510 singletons.
After removing embedded dates and long reference numbers, Notification_type fell to 352,024 distinct values and 90.0% of rows belonged to values seen at least ten times.
PLACEHOLDERS AND MISSINGNESS
The data uses #, 0, 000, MUL, NUL, Not assigned, blanks and other sentinel values. As a highlight:
Approximately 37% of
Wardrows had no usable value and about 39% ofSub_Councilrows had no usable value.Suburbused # for 8.0% of rows in addition to nulls and blanks.
COORDINATE ISSUES - COMPLETENESS VS VALIDITY
A populated coordinate was not automatically a valid location. So I had to test whether values are non-zero, numerically plausible, in a recognised coordinate layout, convertible to latitude and longitude and inside or near the metro boundary.
Some had to be completely rejected and a decision had to be made for downstream processing whether to use a generalised location such as Suburb or Ward. It turned out also that two coordinate systems where in use, hinting of diseparate originating systems.
TEMPORAL COVERAGE
Also checked monthly volumes, gaps, future or implausible dates, created versus changed versus completed dates and repeated requests with conflicting dates.
Whole months where found to be missing in some instances. For example request from February 2025 are missing entirely. Hinting on failed copy/ update operation.
3. The Rulebook
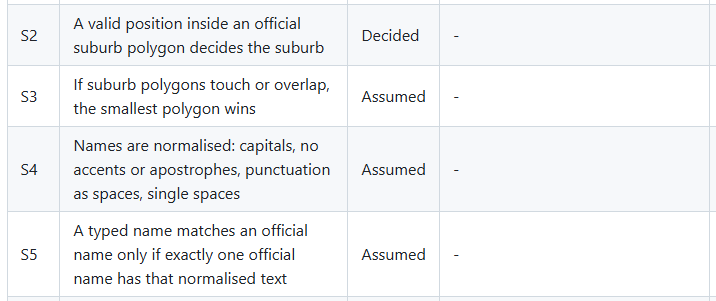
Profiling told what was happening and brought to bear all the data issues. A rulebook was then necessary to record decisions I made about it for the benefit of subsequent data handling steps.
Every rule had to have an ID, the rule itself, its status and the setting controlling it.
A Rulebook extract dealing with the handling of Suburb data.
 |
|---|
| Rulebook Extract |
4. A Data Quality Report
The data-quality report here turns the profiling results into decisions. It shows what was checked, what was found, why it matters and what happens next.
Snapshot: 7 October 2026
Rows profiled: 5,372,466
| Status | Finding | Why it matters | Action |
|---|---|---|---|
| PASS | Notification has no null values. |
Every row has a request identifier. | Use it as the business key, but not as a unique row key. |
| WARN | 709,092 Notification values appear more than once. |
A single request can occupy multiple rows. Counting rows would overstate request volumes. | Investigate repeated records, remove exact copies and define a current-row rule. |
| WARN | Repeated keys create 946,523 extra rows, or about 17.6% of the table. | Raw row counts are not reliable measures of service requests. | Report request-level metrics rather than row-level metrics. |
| WARN | Only 74.3% of rows have non-zero coordinates. | More than a quarter of records may not map correctly. A non-zero value also does not prove that the location is valid. | Separate missingness, coordinate-format checks and boundary validation. |
| WARN | Approximately 37% of Ward values are unusable placeholders. |
Values such as #, 000, 0, MUL, blanks and nulls could create false geographic categories. |
Standardise confirmed placeholders as Unassigned, then validate remaining ward codes. |
| WARN | Approximately 39% of Sub_Council values are unusable placeholders. |
Geographic summaries may suggest precision that the source does not contain. | Convert placeholder values to Unassigned and preserve the missingness signal. |
| WARN | Notification_type has a very long tail and contains dates and reference numbers. |
The field is not a stable category in its raw form, so grouping on it can fragment the results. | Tidy embedded identifiers and use C3_Complaint_Type as the primary category. |
| WARN | Work_Center may contain person-style values. |
Publishing the field could expose staff-related information. | Mask or restrict the field before it reaches published outputs. |
| INFO | The source is treated as a frozen snapshot. | Its age is expected, but the snapshot could still change unexpectedly. | Monitor row count and newest record date for unexplained changes. |
Summarily:
Overally the data is judged as WARN(ING). It means that the data requires documented treatment before it can support trustworthy metrics, i.e. should not be sent directly to a dashboard without deduplication, standardisation and validation
The most important risk is duplication. Because Notification repeats, the dataset contains more rows than requests. A chart showing “number of service requests” would be misleading if it simply counted records.
The second major issue is geographic uncertainty. Missing values are represented in several ways, and coordinates are incomplete. A map therefore needs both valid-location logic and an explicit way to show requests that cannot be placed confidently.
In Conclusion
The profiling produced a useful ‘map of uncertainty.’ I learned that repeated rows were not necessarily duplicate requests; missingness was encoded as more than nulls; one field mixed categories, dates, identifiers and free text and coordinates could be present without being trustworthy.
Most importantly, each discovery became a rule, a test or another question to be answered. The profiling did not make the data look clean. It is made assumptions visible before going to the dashboard.