Cape Flood Safe
27 Dec 2018SCT Part 3
(18.42281, -33.95947)
So, those are the numbers (coordinates) to keep and punch into the satellite navigator in the unlikely event of the Atlantic Ocean bursting its Cape Town shores. If you stay in Cape Town, the first place that comes to mind when you hear ‘Flood Survival’ is likely Table Mountain and rightly so. But, which spot exactly can one stand longest on solid earth in the event of a massive flood?
Cut To The Chase: The Safe Strip
How To DEM
Get Data
Relief maps always get my attention. The mystery of attempting to model reality on the computer enthuses me. There are plenty tutorials on the net on how to do this so here’s my version.
I got some vector base data (Metro Boundary, Suburbs, Roads, Railway Line, Building Footprints and a DEM - Digital Elevation Model ) off City of Cape Town’s Open Data Portal or here. The vector data, I loaded into a geopackage. How? Of special interest was the DEM, described as “Digital model (10m Grid) depicting the elevation of the geographical surface (Bare Earth Model) of the Cape Town municipal area.” The Open Data Portal has the data stored as 10m_Grid_GeoTiff.zip.
Style Terrain
After extracting the compressed elevation data, I loaded it in QGIS.
- Load 10m_BA,
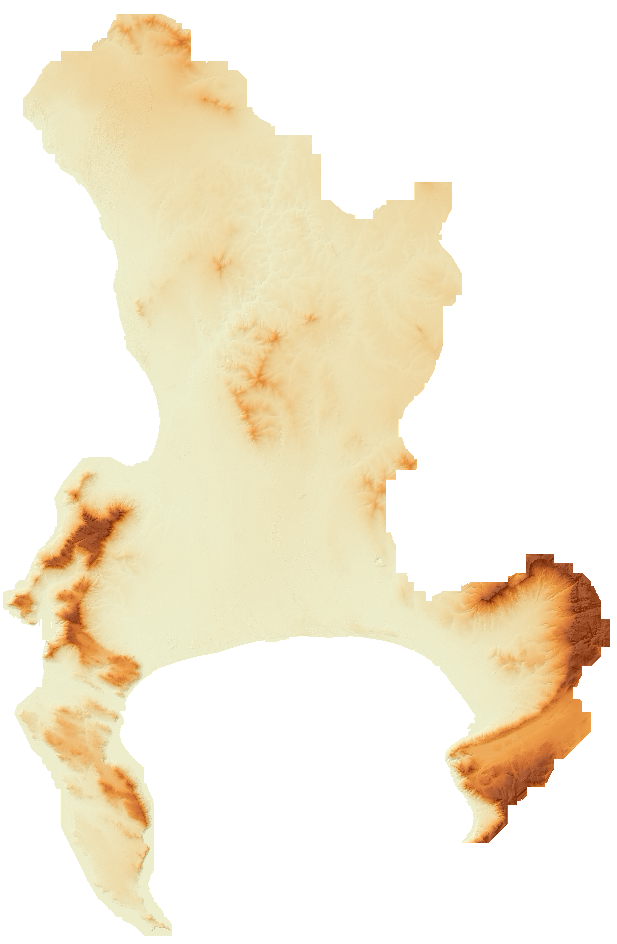
- Style the ‘relief map’ in Properties –> Style
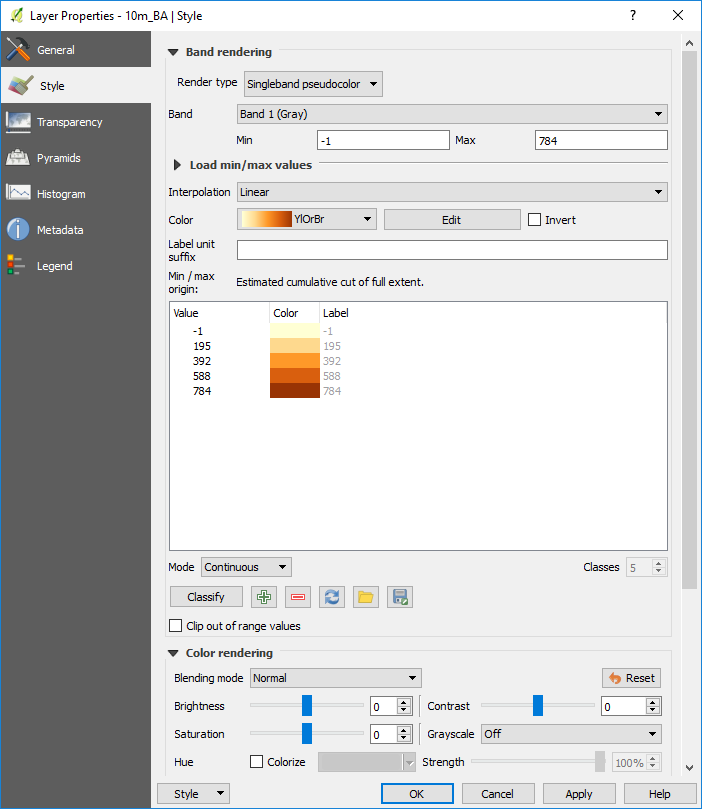
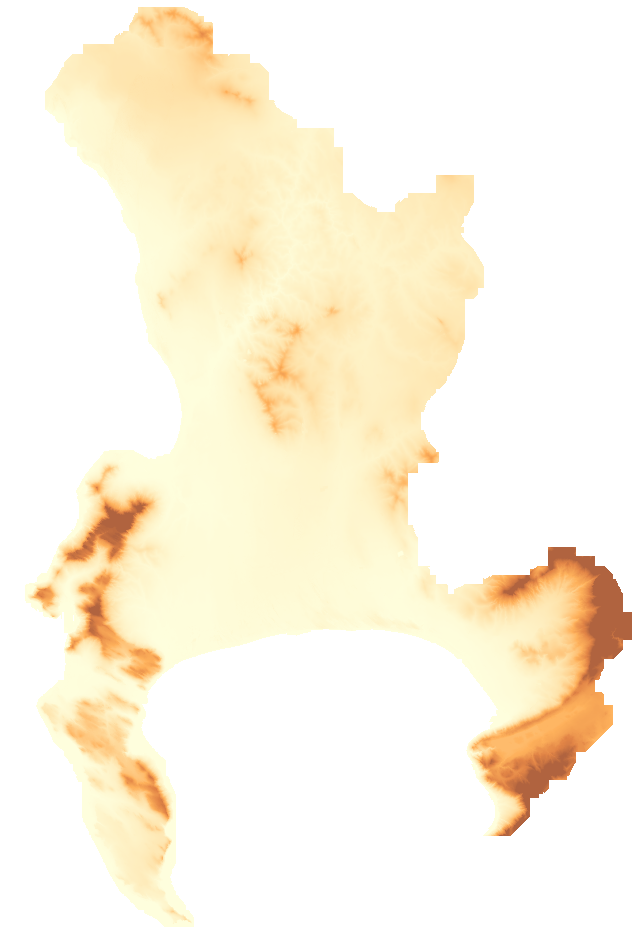
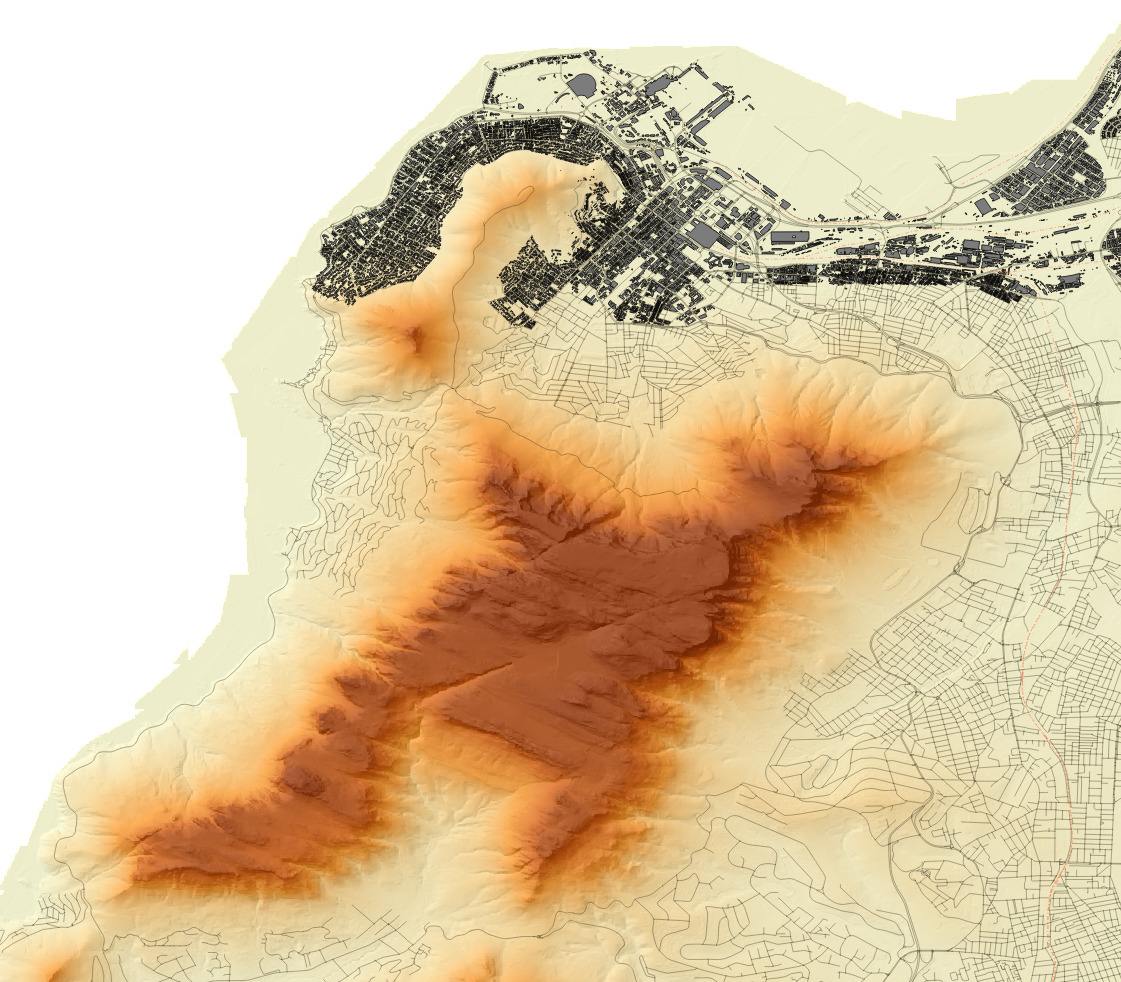
The raster would then look as shown below
-
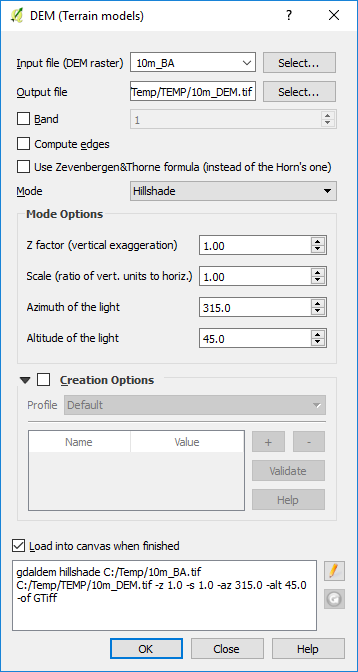
Now to create a hillshade. Do Raster –> Analysis –>DEM (Terrain Models)…
With the settings shown below create a Hillshade DEM
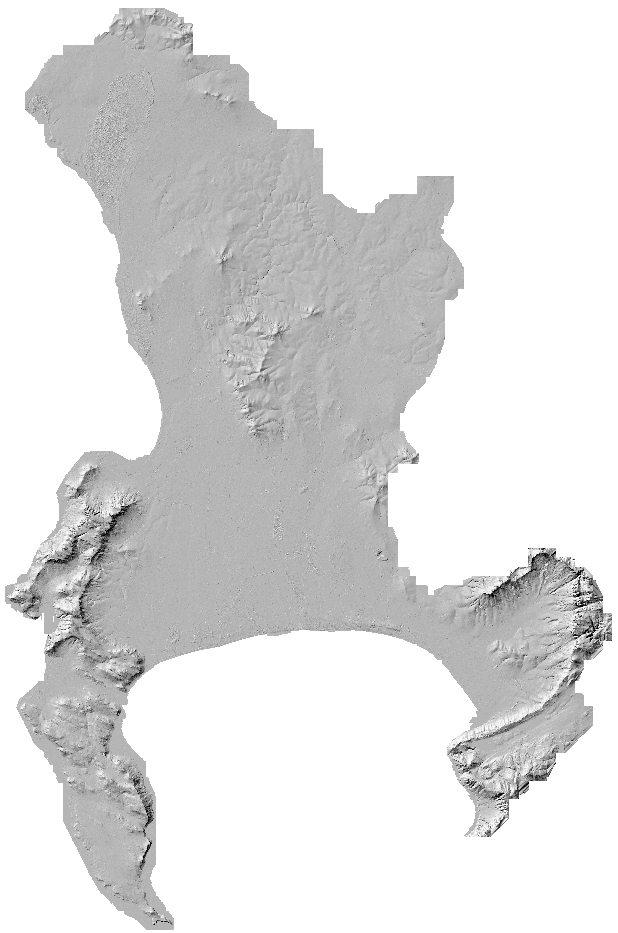
This gives us a hillshade …
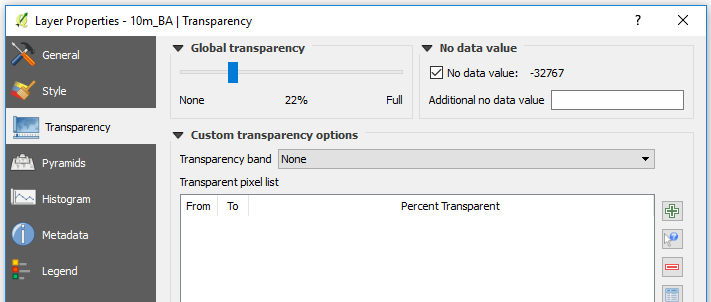
- To get us a Terrain Map. Set transparency in the Relief Map (10M_BA). RightClick –> Properties –> Transparency
- Now a combined view of The Relief and Hillshade …
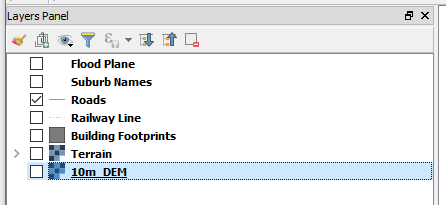
- Now Load the other support vector layers
- Metro Boundary (Flood Plane)
- Suburbs
- Roads
- Railway Line
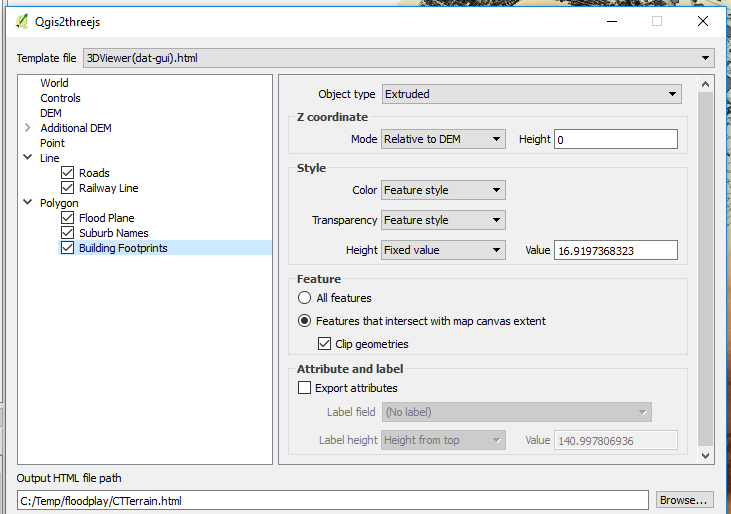
- Building Footprints
Getting 3D
To get started with 3D Terrain. Load and activate the Qgis2threejs Plugin.(Read more). (This is one approach to getting 3D in QGIS. At the time of writing this post, 3D comes native with QGIS. Read (more.). But, I was using QGIS 2.18.7, Portable gotten from here.
The Qgis2threejs Plugin is unique in that it bootstraps the process to have a web ready 3D model to play with.
- Launching the Plugin for the first time should give something like this …
- Zoom to Cape Town CBD and include all of the table of Table Mountain.
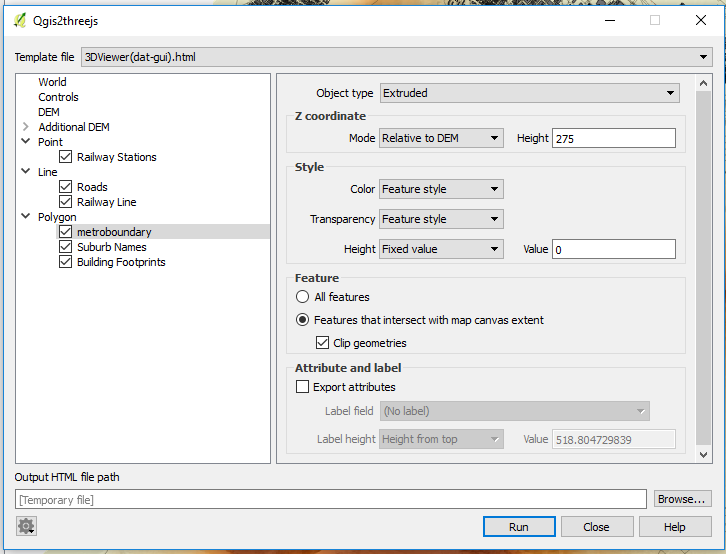
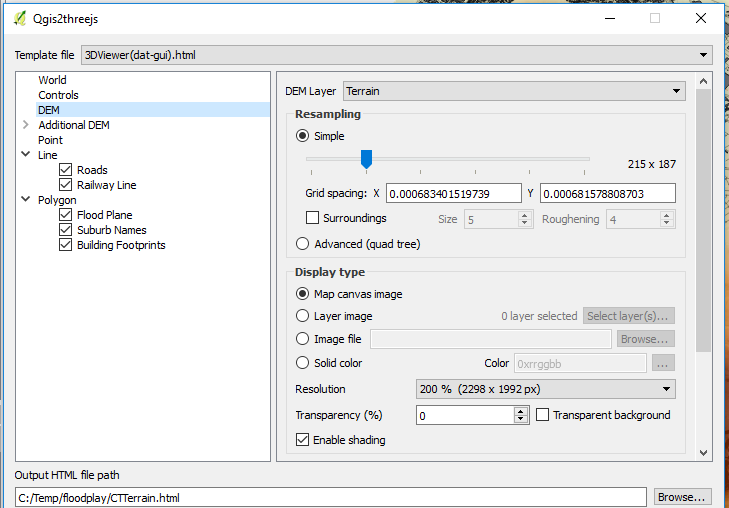
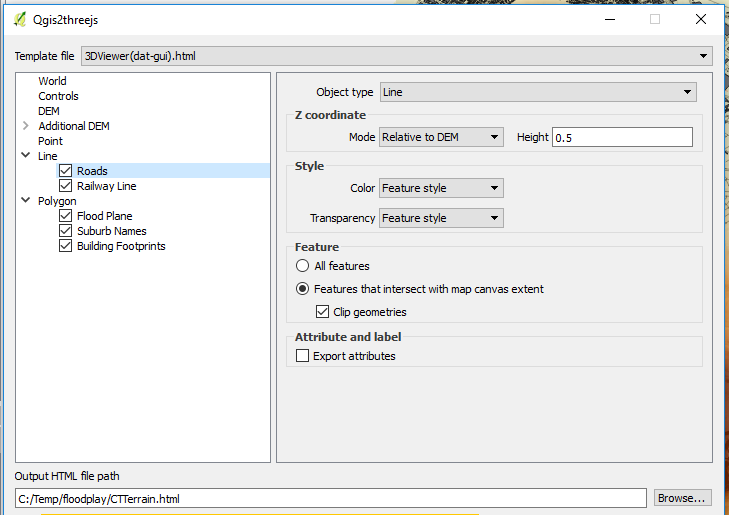
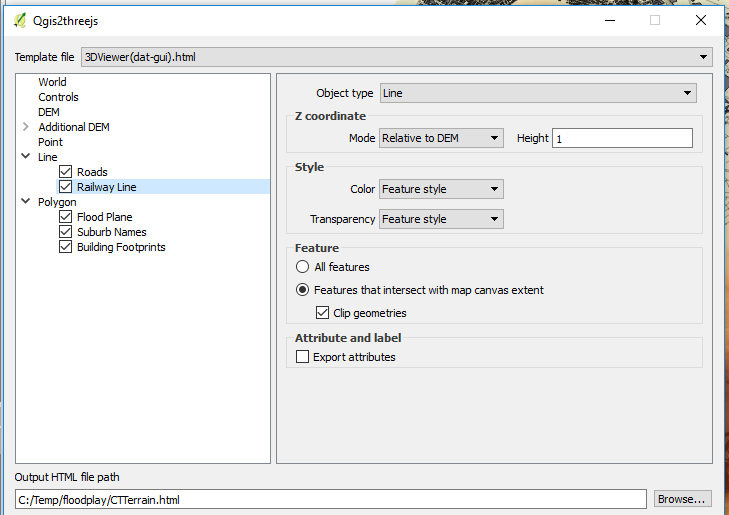
Now, to prepare for exporting the subject area, emulate the following series of settings paying attention to the parts World, DEM, Roads,
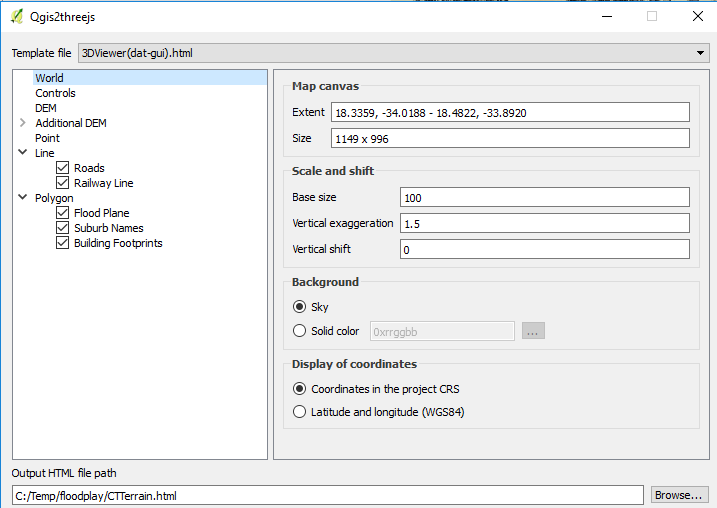
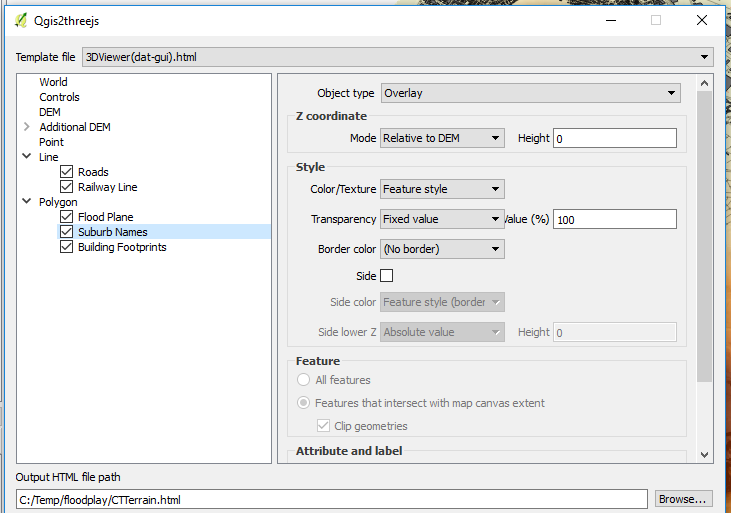
The Surburbs Layer is used mainly for labelling purposes in the final export. We are not interested in showing the Suburbs boundaries for now.
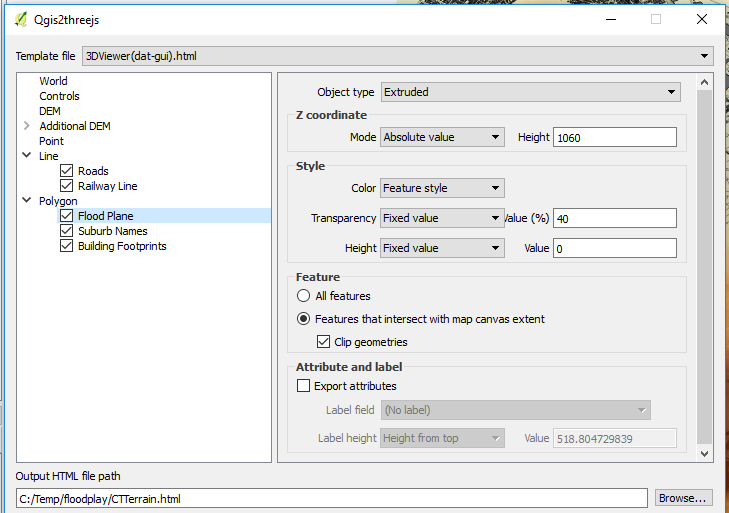
Through Trial and Error and guided by the absolute height of the DEM, we get the optimum height value, 1 060m, to use for our Flood Plane (Which in essence is just a polygon covering all of our area of interest - Metro Boundary in this case).
Export To Web
In order to have an interactive 3D Map simulating a flood.
-
Ensure 3DViewer(dat-gui).html is chosen under the Template file in the Qgis2threejs Plugin.
-
Choose the appropriate path and name for the index html for the visualisation. In this case CCTerrain.html is chosen.
-
Export and Qgis2threejs will generate the necessary style sheets and other files for the export.
-
Now using a text editor, edit parts of the exported html file (CTTerrain.html) to reflect what the project is about and put in some usage information.
A Preview below - full screen here
#PostScript - Find The Safe Spot
Click around the map to turn on/off the layers.