

3. The Data - Spatial, Part 2
25 Jul 2019[A Data Science Doodle]
Shapes Meet Words
This stage is about bringing together the suburbs attribute data of 1. The Data and the spatial data from 2. The Data - Spatial.
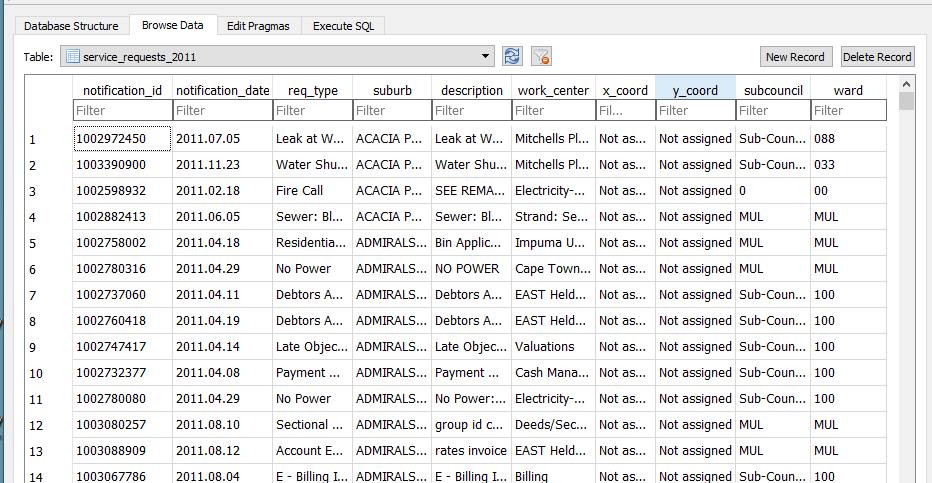
I imported the service_request_2011 data to the geopackage, the data types at this stage are all text and the relation looks thus
-
The fields subcouncil and wards are largely unpopulated and are deleted.
-
modified table in DB Browser for SQLite to reflect correct data type,
| Field Name | Data Type |
|---|---|
| notification_id | (big)int |
| notification_date | date |
| req_type | text |
| suburb* | varchar80 |
| description | text |
| work_center | text |
| x_coord | double |
| y_coord | double |
Getting The Point
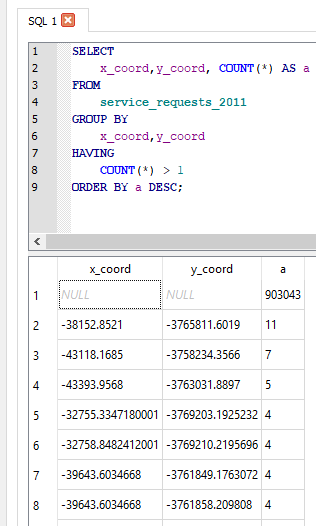
The service request each have an (x_coord, y_coord) pair. However the majority have not been assigned or most likely where assigned to the suburb centroid. So to check on the ‘stacked’ points I ran the query
SELECT
    x_coord,y_coord, COUNT(*) AS a
FROM
    service_requests_2011
GROUP BY
    x_coord,y_coord
HAVING
    COUNT(*) > 1
ORDER BY a DESC
The query revealed:
- Coordinates to be in metres (likely UTM).
- 903 043 records without coordinates.
- The highest repeated coordinate pairs being 11, 7, 5 and the rest 4 and below.
- 3127 records had unique pairs.[ COUNT(*) = 1 in the query above]
Now, identifying invalid x_coord and y_coord i.e coordinates not in the Southern Hemisphere, East of the Greenwich Meridian.
SELECT
    x_coord, COUNT(*) AS a
FROM
    service_requests_2011
WHERE x_coord >0;
(Query was repeated for y coordinate.).
For all the invalid and ‘out-of-place’ coordinate pairs, NULL was assigned.
UPDATE service_requests_2011
SET x_coord = null
WHERE x_coord = 'Not assigned';
(Query was repeated for y coordinate.).
Coming From ?
How Many Requests In This Area
As realised while exploring the service request data, most records did not have the (x, y) coordinate pair, yet consistently had suburb associated with them.
The next step was to assign a coordinate pair to each service request.
The following procedure was adopted.
- Count the records in each suburb (excluding suburb = INVALID). This resulted in a new table service_req_2011_suburb_count.
SELECT suburb, count(suburb) AS records
    FROM service_requests_2011
        WHERE suburb != 'INVALID'
    GROUP BY suburb
    ORDER BY records DESC;
For each of the 4 reference ‘suburb’ layers …
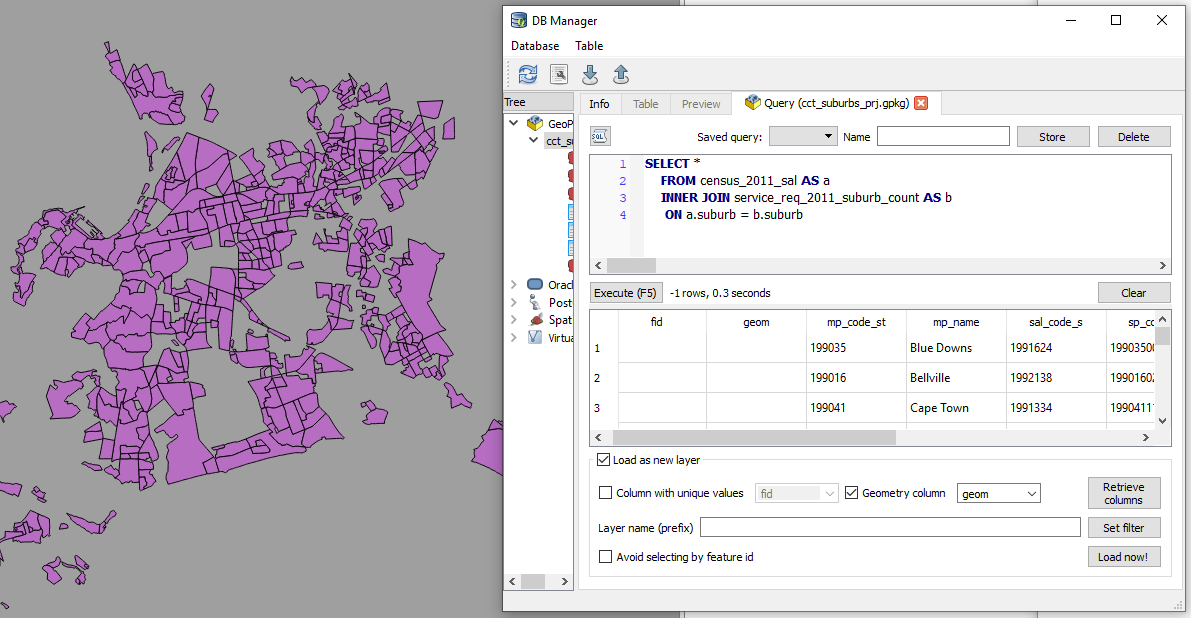
SELECT *
    FROM census_2011_sal AS a
    INNER JOIN service_req_2011_suburb_count AS b
     ON a.suburb = b.suburb
This is essentially a spatial query. ‘Show me all the suburbs from the census_2011_sal layer whose names appear in the *service_request_2011 data.*’ Executed and loaded in QGIS this looks like…
Saved the resultant layer as census_2011_sal_a.
Now the subsequent query must exclude from the service_req_2011_suburb_count all the suburbs already used by census_2011_sal (Why? Some suburbs names are repeated across data sets. This is an ANTI JOIN and one of its variations was adopted).
To get the remainder of the suburbs
SELECT a.suburb, a.records
    FROM service_req_2011_suburb_count AS a
        LEFT JOIN census_2011_sal_a AS b
          ON a.suburb = b.suburb
          WHERE b.suburb IS NULL;
The above query creates a new layer service_req_2011_suburb_count_a.
Now to get the matching suburbs from ofc_suburbs
SELECT *
    FROM ofc_suburbs AS a
    INNER JOIN service_req_2011_suburb_count_a AS b
     ON a.suburb = b.suburb
The results being a new layer, ofc_suburbs_a
Using the same procedure, I ended up with
-
census_2011_sal_a
-
ofc_suburbs_a
-
informal_areas_a
-
suburb_extra_a
which I combined to have one suburbs data layer suburbs with 775 records. This compound suburbs layer is a bit ‘dirty’ (overlapping areas) for some uses but for the current use case, perfect (each area is identifiable by name).
GeoCoding The Service Requests
From the initial investigation there were 3127 records which had a valid x,y coordinate pair. This set is about 0.3% of the entire set. I decided to ignore these and bunch them together with the rest of the unassigned records. Of the 906 500 records of service request, 96 688 have status of INVALID for the suburb, leaving 809 812 to be geocoded.
To geocode the service request, I chose the approach to have point for each service request and these appropriately dotted within a polygon.
A Scatter of Points
Step 1 was to generate random points within each suburb corresponding to the number of requests in it. This is accessible in QGIS.
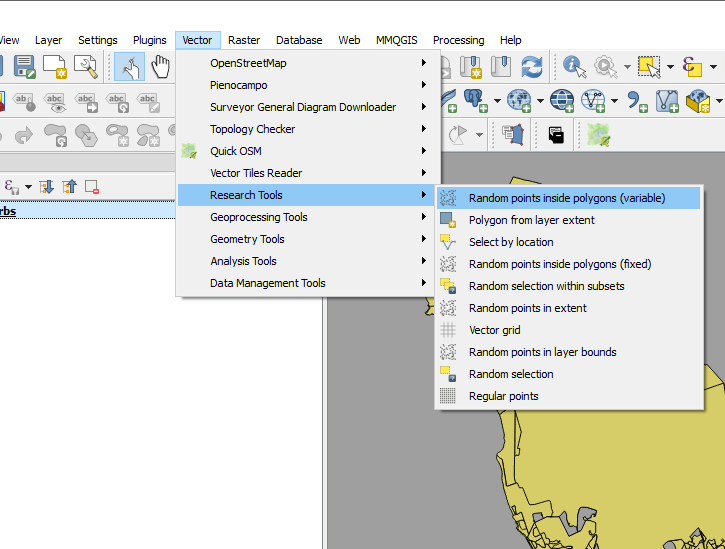
I call this “points scattering.”
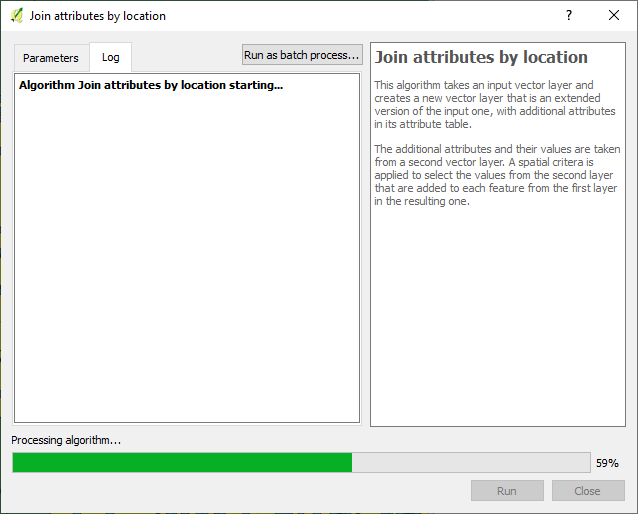
The next step was to assign suburbs to these points i.e. join attributes by location.
Exported the data to geopackage as service_request_points_a with 809 812 points.
So I could do some advanced sql queries on the data. I loaded the data to PostGIS with EPSG 4326.
I then ended up with a set of points, 809 812, which were supposed to have appropriate notification_ids associated with them.
Geography to Requests
Getting the generate points to have notification ids proved to be a challenge. (Revealing a knowledge gap in my skillset). I resorted to tweeter without success.
I decided to ‘brute-force’ the stage for progress’ sake with the intention of reviewing this at a later stage.
So I sorted the service_request_2011 data by suburb, then exported the result (notification_id, suburb) to csv.
SELECT notification_id, suburb from service_requests_2011
WHERE suburb != 'INVALID'
ORDER BY suburb ASC;
The sorting procedure was repeated for notifification_points_no_ids (the random spatial points data created in A Scatter of Points .), exporting (fid, suburb) to csv.
In a spreadsheet program (LibreOpenCalc), I opened the two csv files, pasted the fields side by side (the suburbs aligned well since they were sorted in alphabetical order). The resultant table, with fields - notificaion_id and fid, was exported as csv, reimported into the database as a table.
To get the geocoded service_requests_2011
-- Assign ids of spatial points to service requests ---
CREATE TABLE requests_2011_with_ids AS
SELECT a.*, b.fid
 FROM requests_2011 as a
 JOIN requests_notif_id_points_ids as b
 ON a.notification_id = b.notification_id;

--- Attach service requests to the points ---
CREATE TABLE requests_2011_geocoded AS
SELECT b.*, a.geom
 FROM requests_points as a
 JOIN requests_2011_with_ids as b
 ON a.fid = b.fid;
Next up…some eye candy! With a purpose.
#Postscript
-
Here’s the GeoPackage (Caution! 382MB file) with all the data up to this stage.
-
Using each of the ‘suburbs’ layers used, I created centroids - this can be used later for labelling a cluster of points to get context.
-
While generating points in polygon based on count, the QGIS tool bombed out at a stage. I iteratively ran the tool (taking groups of suburb polygons at a time) to isolate the problem polygon - JOE SLOVO (LANGA).I then manually edited the polygon, then generated the points for it. This error made me question the validity checking procedure I had performed on the data. Add to that, doing an intersect using data in a geographic coordinate system led to unexpected results - Q warns on this beforehand. One scenario was having more than the specified number of random points generated per polygon, e.g. 18 instead of a specified 6. (With the algorithm reading the value from attribute of the data.)
-
Running the spatial queries in the GUI (QGIS) took considerable time due to the sheer number of records. Intersecting the points and the polygons can be improved, taking a tip by Paul Ramsey from here for speed, with the data in PostGIS.
-- CHANGE STORAGE TYPE --
ALTER TABLE suburbs
 ALTER COLUMN geom
 SET STORAGE EXTERNAL;

--Force COLUMN TO REWRITE--
UPDATE suburbs
 SET geom = ST_SetSRID(geom, 4326)

--Create a new table of points with the correct suburbs--
CREATE TABLE points_with_suburbs AS
SELECT *
 FROM suburbs a
 JOIN points_in_polygons b
 ON ST_Intersects(a.geom, b.geom)