

1. The Data - Service Requests
20 Jun 2019[A Data Science Doodle]
Introduction
This post is the first in a series, The Data Science Doodle, chronicling my journey deliberately, informally getting into Data Science. I plan to write experiences, learnings and report on projects I work on. At the writing of this post, I am working through the R for Data Science book and ‘concurrently’ exploring a dataset of interest. The idea is to evaluate my thought process and workflows, see how, what I learn can be applied to my real world.
The Project
The City of Cape Town makes some of its data publicly available on its Open Data Portal. There’s a plethora of data themes from which one can draw insights about that city from a public service perspective. My focus is on a dataset of Service Requests. Several questions and conclusions can be drawn by digging deeper into this data. I am to understand this data better and see how R can be used to process and manipulate it.
A Brief on Service Requests
The City of Cape Town’s C3 Notification system (now 2019, referred to as Service Requests) was introduced in 2007 to enable the municipality to better manage and resolve residents’ complaints. The success of the system was acknowledged when the City received an Impact Award for Innovation in the Public Sector at the Africa SAP User Group (AFSUG) in 2011.
It is an internal process that is used to record, track and report complaints and requests from residents and ratepayers. There are about 900 different complaint types ranging from potholes, water leaks, power outages and muggings, to employee pay queries or internal maintenance requests.
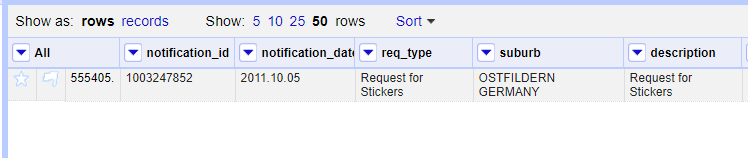
When residents contact the City, a notification is created on the C3 system. All possible types of complaints for the various different City Departments are catalogued (dated, categorised and geo-coded). The complainant is then given a reference number, which allows them to follow up on the complaint. The notification will be closed as soon as the complaint has been dealt with.
The City’s Call Centre can be contacted by using several channels; calls, email, sms, city’s website, facebook, twitter, App - Transport for Cape Town.
Digging-In
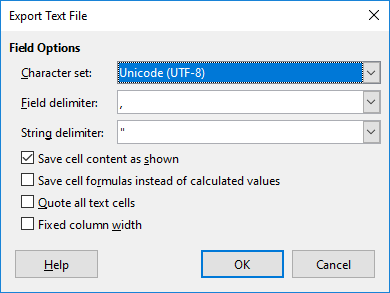
The Service requests data can be downloaded in Microsoft Excel format or ODS. To investigate the data I resorted to LibreCalc and OpenRefine ~ a free, open source, powerful tool for working with messy data.
Alex Petralia puts it out well
OpenRefine is designed for messy data. Said differently, if you have clean data that simply needs to be reorganized, you’re better off using Microsoft Excel, R, SAS, Python pandas or virtually any other database software.
Data Explore
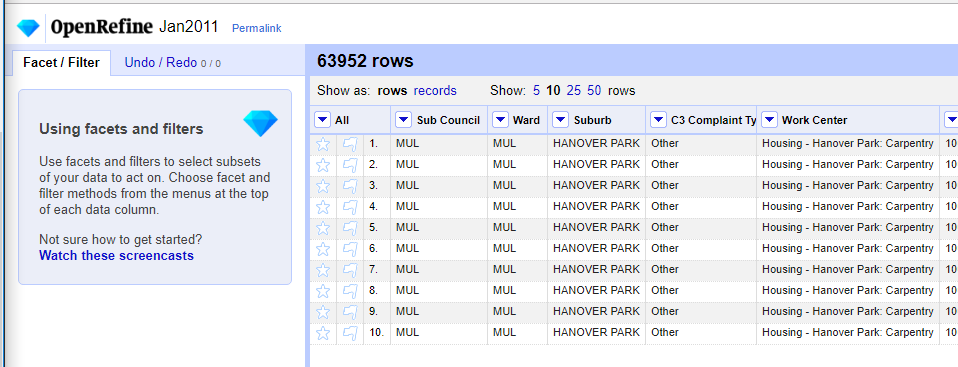
OpenRefine(OR) can work with .ods files but, I struggled to load the January 2011 file. I even increased OpenRefine’s default memory (from 1024 to 2048) setting, still there was struggle loading the file. Opening the file in LibreCalc revealed that the first four rows in the month’s services request records were descriptive fields which even included merged cells. I deleted these and exported the file to text (csv) format.
After the export the file loaded like a breeze in OpenRefine.
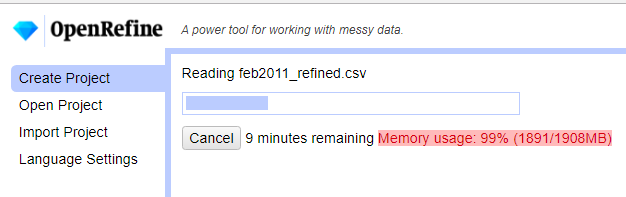
I repeated the .ods file cleaning procedure in LibreCalc for all the remaining files February to December 2011. I then imported all 12 csv files into OpenRefine. Again memory was an issue and I increase the value to 4096.
Cleaning Up
All fields where imported as as string/ text into OR. I then renamed and redefined data types of the field names to have some structure.
| Original Field Naame | New Field Name | Data Type |
|---|---|---|
| Sub Council | subcouncil | text |
| Ward | ward | text |
| Suburb | suburb* | varchar80 |
| C3 Complaint Type | req_type | text |
| Work Centre | work_center | text |
| Notification | notification_id | int |
| Column | description | text |
| X-Y Co ordinate 1 | x_coord | text |
| X-Y Co ordinate 2 | y_coord | text |
| Created On Date | notification_date | text |
| Notification Created (just ‘1’s) | *removed/ deleted | |
| Imported .csv file name | *removed/ deleted |
Notes:
- (*) planning to index the suburb field.
- x_coord, y_coord: set to text for now as focus on them will be much later.
- notification_date: Is truly date, formatting will be later.
- notification_id: is the unique request identifier. Assigned type (BIG)INT (so as to avoid problems later when the data grows - Hint from the web, Digital Ocean.)
Aside: Now, is it work_centre or work_center ? well, it’s command center!
The following operations where applied to the fields to clean it somewhat in OR;
- Trimmed white spaces.
- Collapsed consecutive white spaces.
- Convert all suburb names to uppercase.
- Transformed notification_id To Number
- Reformatted notification_date to the format YYYY.MM.DD .(The plan being to later import the data into a PostgreSQL database.)
Some OR transformation expressions and functions are documented here.
For the date transformations I took a hint from here and using the expression
value.slice(6, 10) + '.' + value.slice(3, 5) + '.' + value.slice(0, 2)
another GREL expression which was widely applied to populate a field with values from another field
cells["work_centre"].value
Messy Suburbs
The most time consuming stage was cleaning the names of the suburbs. Why suburb? As a “geo” person, the mind is wired to think geocoding and suburbs is a good reference. The (x_coord, y_coord) pair for this dataset was largely unassigned which led to the focus on suburb.
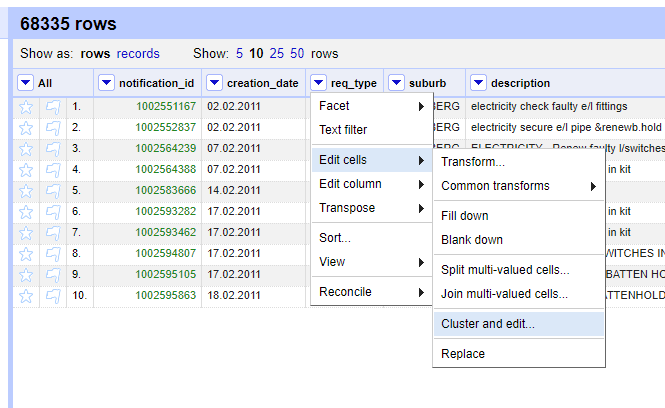
The Cluster and Edit Operation was mostly used. The variations in the names was very wide. Hinting to a lack of standardisation on the names and most likely alluding to the use of ‘free-text’ in the initial capture of the Service Requests.
Some records had suburb value ‘UNASSIGNED’. For suburbs which did not ‘make sense’ in a local context, like London, UK, I assigned INVALID.
Taking Stock (A Database)
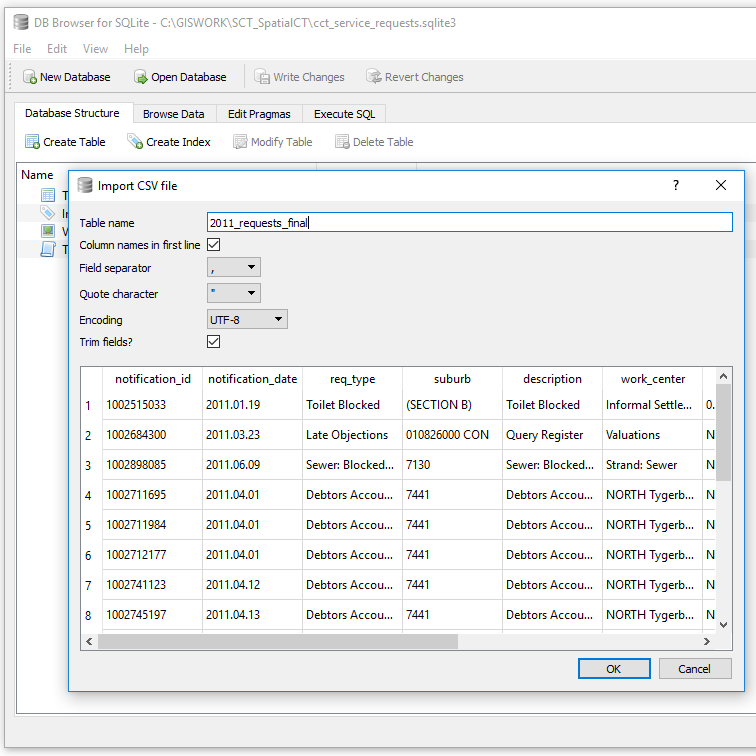
As an intermediate stage I exported the records as SQL from OR to a sqlite database. cct_service_requests.sqlite3
[Aside: “use .sqlite3 since that is most descriptive of what version of SQLite is needed to work with the database”;Tools: DB Browser for SQLite Version 3.10.1 (Qt Verson 5.7.1, SQL Cipher Version 3.15.2)]
Exporting the records to SQL from OR resulted in Out of Memory issues even with 6GB dedicated to OR and the data with 906501 records. I resorted to importing a CSV instead.
I was looking at retaining suburbs with atleast 5 or more records or less if there was a corresponding suburb defined. Those with any less were assigned to the larger area boundary. To get insight into the suburbs I used the SQL Query
SELECT count(suburb) as a, suburb
 FROM service_requests_2011
    GROUP BY suburb
    ORDER BY a DESC;
There were 3659 unique suburbs. Largely with a count of one, of which on inspection were clearly a result of typos during data entry.
Having done the identification of non-unique suburbs. The task was now to identify these in OR and clean them up.
Getting Help
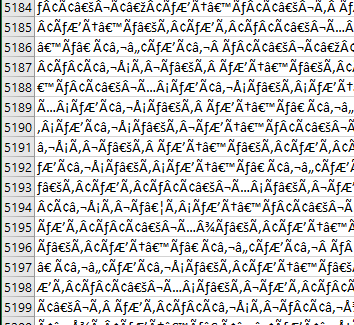
Somewhere along the processing I came across ‘noise’ in the data which gave me memory issues in OR and spreadsheet programs. This had caused the data file to balloon to 800MB+.
I resorted to twitter for help
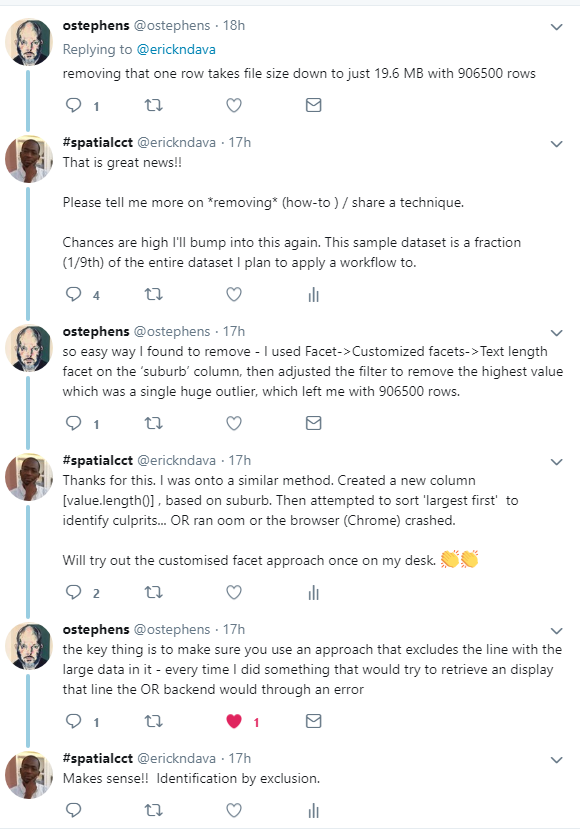
In summary the technique to clean the data was
I used Facet -> Customized facets -> Text length Facet on the ‘suburb’ column, then adjusted the filter to remove the highest value which was a single huge outlier…
The problem record entry was notification_id = 1003477951. I deleted this and proceeded with the cleaning.
Readying
After further cleaning there were now 1100 unique suburbs with the highest count of 4.
The Next Stage was to match this service request data with the spatial reference frame.
At this stage one can start doing miscellaneous analysis of the 2011 service requests. Distribution per month, per suburb, most requested service, etc.
#PostScript
True to the “80% is spend in data cleaning” assertion, this portion of the project took a lot of time! Next up is the preparation of spatial data for the suburbs. Using the suburbs list from service_requests_2011, collate a corresponding spatial dataset.